Software Analytics Platforms
Learning Objectives
- Identify tools for data visualization
- Install a local instance of GrimoireLab software
Introduction
Software analytics platforms are a quick way to build customized applications with a common interface. The platform we will be exploring today has been assembled by integrating and coordinating many open source components. The analytics platform GrimoireLab, is composed of back-end components such as Elastic Search, Redis and MariaDB; visualization components such as Kibana, Sigils, and Manuscript; front-end components such as React and data retrieval components that use the Python library Perceval.
Importance
The ability to customize an off-the-shelf application which pulls data from a variety of sources and then be able to interact with visualizations can be an incredibly valuable asset. Modern products often pull code from many GitHub repositories, involve numerous developers and have communication channels for community participation which makes keeping track of important events challenging. Product owners needing to monitor all the moving parts may find it convenient to have one place to get a quick overview, make assessments and inform their decisions.
Prerequisite Knowledge
- Docker installed on your local machine
- A GitHub account
- Git installed locally
- Familiar with the command line
- A Text Editor or an Integrated Development Environment (IDE)
Installations instructions are written for a Mac, which in most cases will translate relatively well to a Linux machine.
Goal and end-product
GrimoireLab is a product made by an organization called Community Health Analytics for Open Source Software (CHAOSS ). Installation instructions already exist, though at the time of writing it is acknowledged that they are difficult to follow. The goal of this exercise is to install a local instance of GrimoireLab and configure it with a set of GitHub repositories. The easiest installation path deploys from DockerHub.
Task Description
Exercise: Install GrimoireLab
- Obtain a Personal Access Token from your GitHub account (read access only).
- Obtain GitHub urls of repositories you’d like to run analytics against.
- Create local directories and required files. Copy and paste the following into a command line terminal:
mkdir ~/grimoireLab && mkdir ~/grimoireLab/logs && cd ~/grimoireLab \
&& touch projects.json && touch credentials.cfg
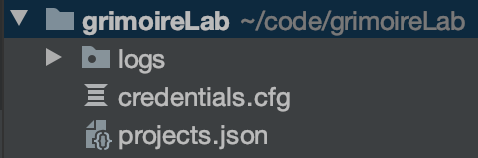
Screen shot of directory structure
- Place urls in `projects.json` in the following format. Copy, paste and replace (urls) the following into the file `projects.json`. Note: More than one repo is permitted in the configuration file, which is helpful since repos are often part of a resource group.
{ "OCWA": { "git": [ "https://github.com/bcgov/OCWA.git", "https://github.com/bcgov/ocwa-file-scanner.git", "https://github.com/bcgov/url-filter-proxy.git" ], "github": [ "https://github.com/bcgov/OCWA", "https://github.com/bcgov/ocwa-file-scanner", "https://github.com/bcgov/url-filter-proxy" ] } } - Place Personal Access Token in `credentials.cfg`. Copy and paste the following into the file `credentials.cfg` and make sure to replace the api-token with an actual token.
[github]
api-token = 4a8809_REPLACE_WITH_A_REAL_TOKEN_9c34b125a90c6761
- Run Docker. Copy and paste the following command into a terminal
docker run -p 127.0.0.1:9200:9200 -p 127.0.0.1:5601:5601 \ -v $(pwd)/logs:/logs \ -v $(pwd)/credentials.cfg:/override.cfg \ -v $(pwd)/projects.json:/projects.json \ -t grimoirelab/full - In a few minutes, once docker has pulled down all images locally, check http://localhost:5601 to view your dashboard

Screen shot of GrimoireLab software analytics platform
Scenario
Your development team needs to deliver a new feature, which will be an enhancement to your existing code base. It will be easier to adopt and incorporate an existing open source library available on GitHub than build something from scratch. You discover you have a few options. Before you move ahead with a decision, you need assurance that the health of the community around the third-party, open source library is strong; you need to minimize the chance that you will have to refactor later. Using the GrimoireLab instance you just set up, identify which metrics you could use to assess the health of the community around the repository of your choice.
- Pick a Github repository that you’d like to evaluate, enter the urls in `projects.json` file.
- Referencing the documentation on Business Risk from CHAOSS identify the ‘Elephant Factor’ and the ‘Committers’ metric in the GrimoireLab dashboard.
- Make a determination, based on your assessment of risk, if you would recommend adopting the code base you’ve chosen.
Additional Resources